Monitor billing and usage
Monitor billing and usage metrics for your account and projects from the console or API
Neon exposes usage metrics in the Neon Console and through the Neon API. These metrics can answer questions like:
- What's my current bill?
- How much storage am I using?
- How many compute hours have I used?
- How many projects do I have?
- How many branches do I have?
View usage metrics in the Neon Console
Usage metrics in the console can be found on the Billing page, the Project Dashboard, and the Branches page.
Billing page
You can monitor billing and usage for all projects in your Neon account from the Billing page in the Neon Console.
- Navigate to the Neon Console.
- Select your Profile.
- Select Billing from the menu.
Here you will find the current bill and total usage for all projects in your Neon account.
Usage metrics on the Billing page include:
- Storage: Storage is the total volume of data and history for your project, measured in gibibytes (GiB). Data refers to the logical data size. History consists of Write-Ahead Logging (WAL) records capturing the data’s change history that is used to enable branching-related features. The displayed value reflects your current usage, including any extra storage that has been automatically added as a result of exceeding your plan's allowances.
- Compute: The total number of compute hours used during the current billing period. Compute usage is reset to zero at the beginning of each month. For example, on the Launch plan, compute usage will be set back to 0/300h at the beginning of each month. On the Free Tier, this metric only applies to non-primary branch computes.
- Projects: Number of projects currently active in your account. The displayed value reflects your current usage, including any extra projects that have been automatically added as a result of exceeding your plan's allowances.
- Branches (Free Tier only) Number of database branches currently active in your account. On The Free Tier, there is a 10-branch allowance.
The peak usage triangle indicates the highest usage level reached for that metric during the current billing period. Extra charges are automatically applied based on the number of additional units needed to cover your excess usage, prorated from the date the excess was allocated.

Interpreting usage metrics
-
Compute usage is tracked in compute hours. A compute hour is 1 active hour for a compute with 1 vCPU. For a compute with .25 vCPU, it takes 4 active hours to use 1 compute hour. On the other hand, if your compute has 4 vCPUs, it takes only 15 minutes to use 1 compute hour.
note
On the Free Tier, the primary branch compute is a 0.25 vCPU compute that is always available, so allowances do not apply to your primary branch. You can run your 0.25 vCPU compute on the Free Tier 24/7. Only branch computes on the Free Tier have an allowance, which is the 5 compute hour/month allowance that Free Tier users see on the Billing page. On the Free Tier, this is actually 20 hours of usage because the compute size on the Free Tier is 0.25 vCPU. You cannot increase the compute size on the Free Tier.
-
Storage includes your data size and history. Neon maintains a history of changes to support branching-related features such as point-in-time restore. The Launch plan supports up to 7 days of history retention, and the Scale plan supports up to 30 days. Keep in mind that history retention increases storage. More history requires more storage. To manage the amount of history you retain, you can configure the history retention setting for your project. See Configure history retention.
-
What about extra usage?
The Launch plan supports extra storage and compute usage. The Scale plan supports extra storage, compute, and project usage. Any extra usage allowance is automatically added (and billed for) when you exceed the allowances included in your plan's base fee. If extra usage occurs, it is reflected in your monthly allowance on the Billing page. For example, if you purchased an extra 10 GiB of storage when you exceed your 50 GiB storage allowance on the Scale plan, the extra 10 GiB is added to your Storage allowance on the Billing page. Extra storage and projects reset at the beginning of the next month based on current usage. See Extra usage to learn more.
Project Dashboard
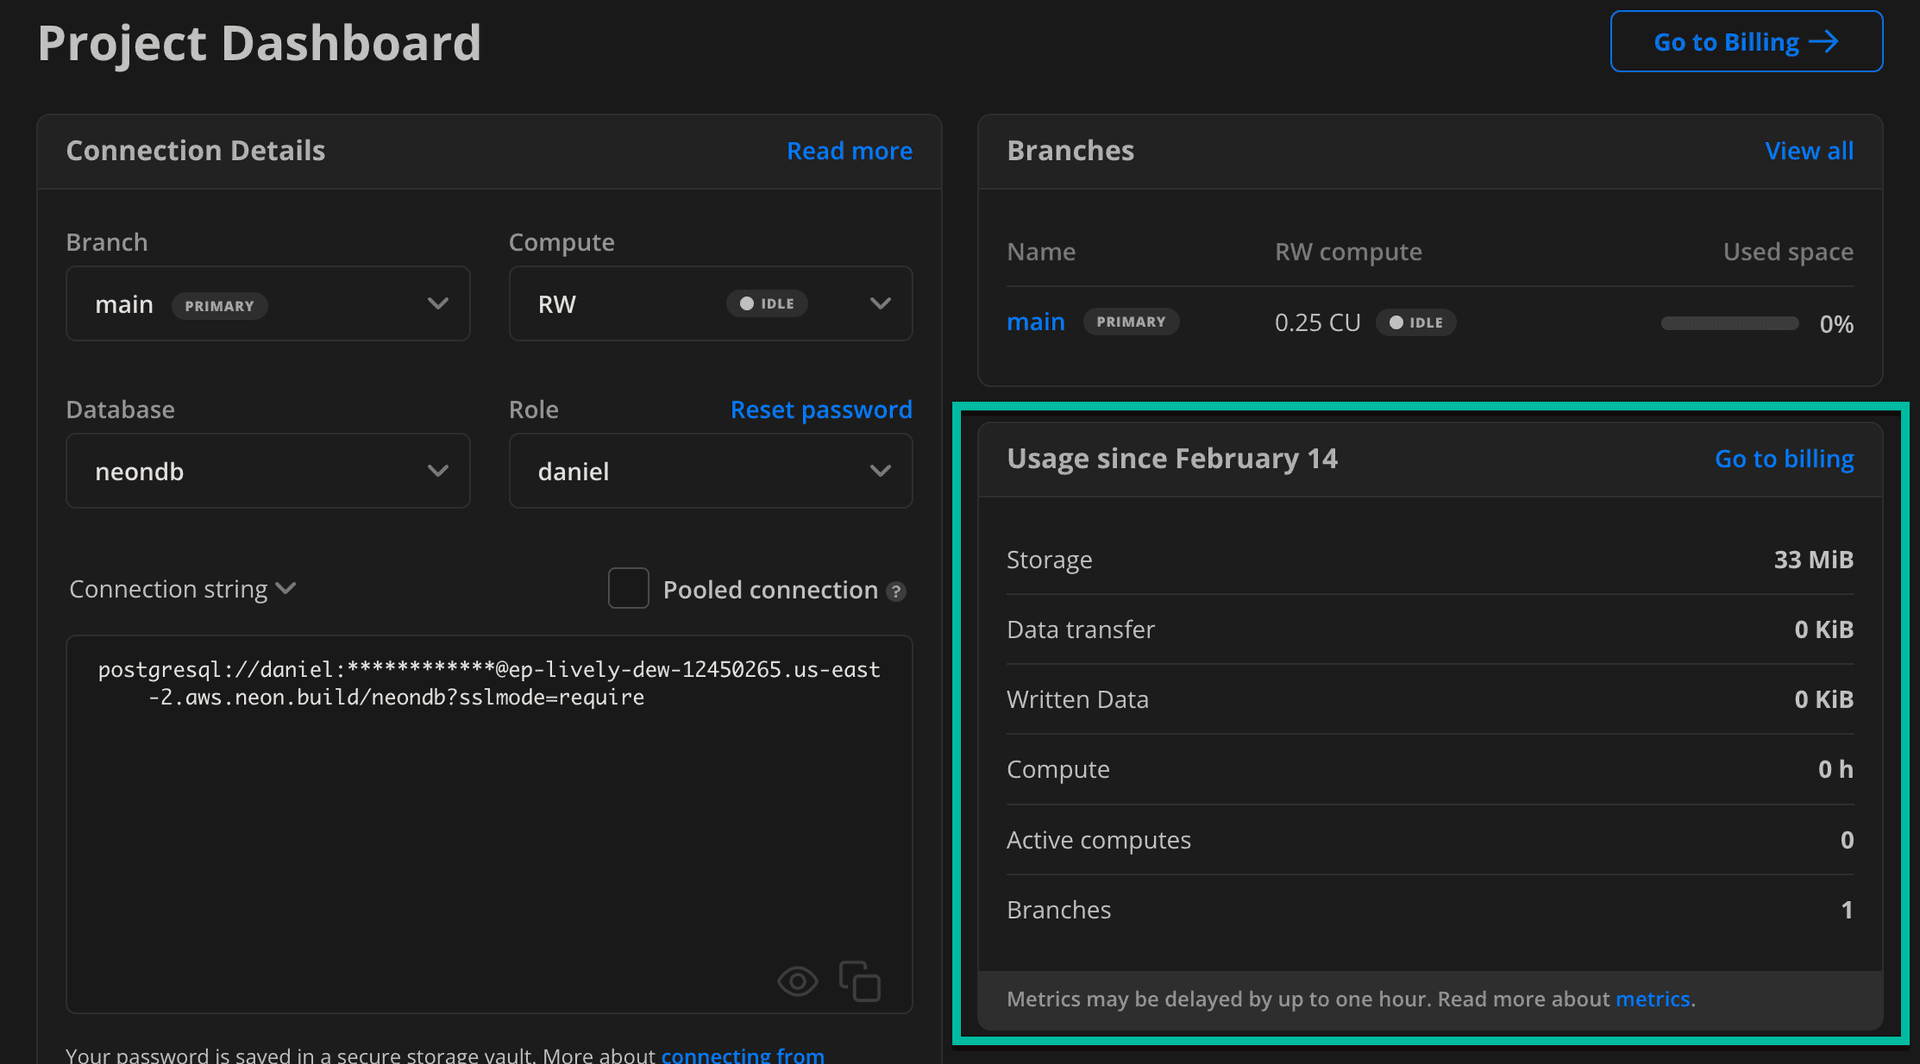
The Usage widget on the Neon Dashboard shows a snapshot of project usage.

Usage metrics include:
- Storage: The total volume of data and history for your project, measured in gibibytes (GiB). Data refers to the logical data size. History consists of Write-Ahead Logging (WAL) records capturing the data’s change history that is used to enable branching-related features.
- Data transfer: The total volume of data transferred out of Neon (known as "egress") during the current billing period. The Free Tier has an egress limit of 5 GiB per month.
- Written data: The total volume of data written from compute to storage during the current billing period, measured in gigibytes (GiB).
- Compute: The total number of compute hours used during the current billing period.
- Active computes: The current number of active computes in your project.
- Branches: The number of branches in your project.
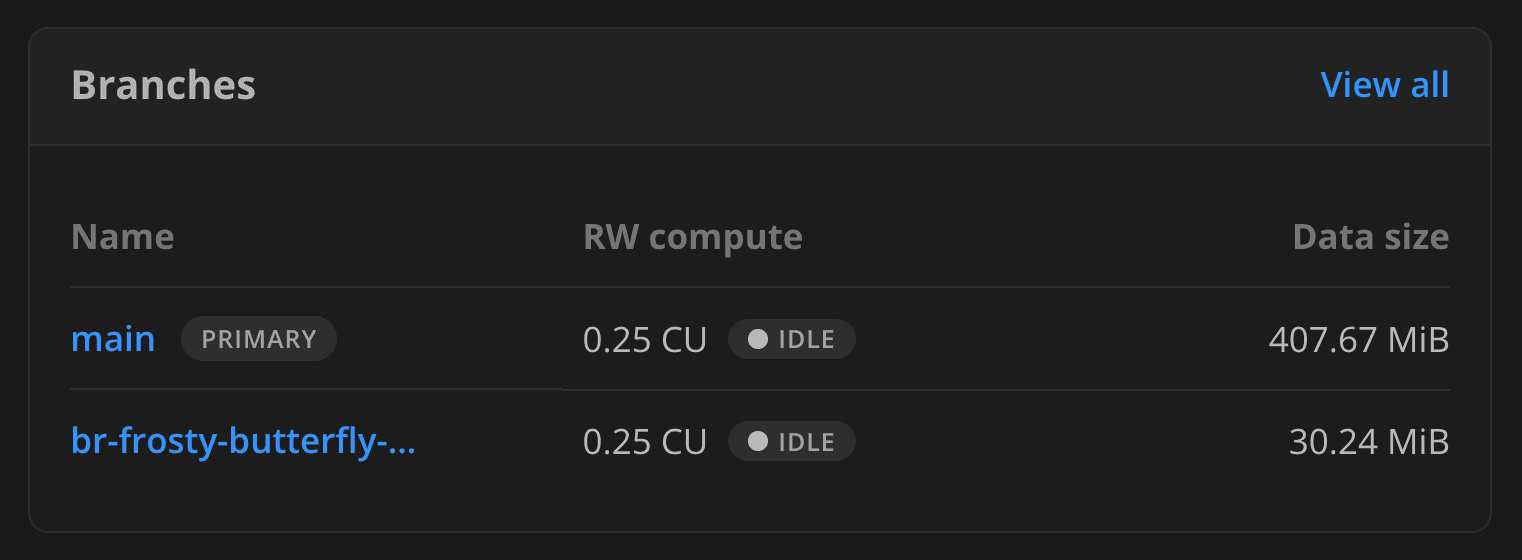
The Branches widget shows a Data size metric, which is the size of the actual data on your branch. It does not include history.

Branches page
The Branches page in the Neon Console provides branch-specific metrics, including:
- Active time: The active hours for the branch compute.
- Data size: The size of the actual data on your branch, not including history.
- Last active: The data and time the branch was last active.
To view the branches in your Neon project:
- In the Neon Console, select a project.
- Select Branches to view the branches for the project.
You can select a branch from the table to view additional details about the branch.
Retrieve usage metrics with the Neon API
Using the Neon API, you can retrieve a variety of usage metrics, which are highlighted in the Get branch details and Get project details examples below.
Get branch details
This example shows how to retrieve branch details using the Get branch details API method. Usage data is highlighted. Refer to the response body section of the Get branch details documentation for descriptions.
curl --request GET \
     --url https://console.neon.tech/api/v2/projects/summer-bush-30064139/branches/br-polished-flower-a5tq1sdv \
     --header 'accept: application/json' \
     --header 'authorization: Bearer $NEON_API_KEY' | jq
Response body
{
  "branch": {
    "id": "br-polished-flower-a5tq1sdv",
    "project_id": "summer-bush-30064139",
    "name": "main",
    "current_state": "ready",
    "logical_size": 427474944,
    "creation_source": "console",
    "primary": true,
    "protected": false,
    "cpu_used_sec": 2505,
    "compute_time_seconds": 2505,
    "active_time_seconds": 9924,
    "written_data_bytes": 1566733560,
    "data_transfer_bytes": 40820887,
    "created_at": "2024-04-02T12:54:33Z",
    "updated_at": "2024-04-10T17:43:21Z"
  }
}
Get project details
This example shows how to retrieve project details using the Get project details API method. Usage data is highlighted. Refer to the response body section of the Get project details documentation for descriptions.
curl --request GET \
     --url https://console.neon.tech/api/v2/projects/summer-bush-30064139 \
     --header 'accept: application/json' \
     --header 'authorization: Bearer $NEON_API_KEY' |jq
Response body
{
  "project": {
    "data_storage_bytes_hour": 113808080168,
    "data_transfer_bytes": 40821459,
    "written_data_bytes": 1566830744,
    "compute_time_seconds": 2785,
    "active_time_seconds": 11024,
    "cpu_used_sec": 2785,
    "id": "summer-bush-30064139",
    "platform_id": "aws",
    "region_id": "aws-us-east-2",
    "name": "summer-bush-30064139",
    "provisioner": "k8s-neonvm",
    "default_endpoint_settings": {
      "autoscaling_limit_min_cu": 0.25,
      "autoscaling_limit_max_cu": 0.25,
      "suspend_timeout_seconds": 0
    },
    "settings": {
      "allowed_ips": {
        "ips": [],
        "protected_branches_only": false,
        "primary_branch_only": false
      },
      "enable_logical_replication": false
    },
    "pg_version": 16,
    "proxy_host": "us-east-2.aws.neon.tech",
    "branch_logical_size_limit": 204800,
    "branch_logical_size_limit_bytes": 214748364800,
    "store_passwords": true,
    "creation_source": "console",
    "history_retention_seconds": 86400,
    "created_at": "2024-04-02T12:54:33Z",
    "updated_at": "2024-04-10T17:26:07Z",
    "synthetic_storage_size": 492988552,
    "consumption_period_start": "2024-04-02T12:54:33Z",
    "consumption_period_end": "2024-05-01T00:00:00Z",
    "quota_reset_at": "2024-05-01T00:00:00Z",
    "owner_id": "8d5f604c-d04e-4795-baf7-e87909a5d959",
    "owner": {
      "email": "alex@domain.com",
      "branches_limit": -1,
      "subscription_type": "launch"
    },
    "compute_last_active_at": "2024-04-10T17:26:05Z"
  }
}
For related information, see Retrieving details about a project.
Last updated on